|
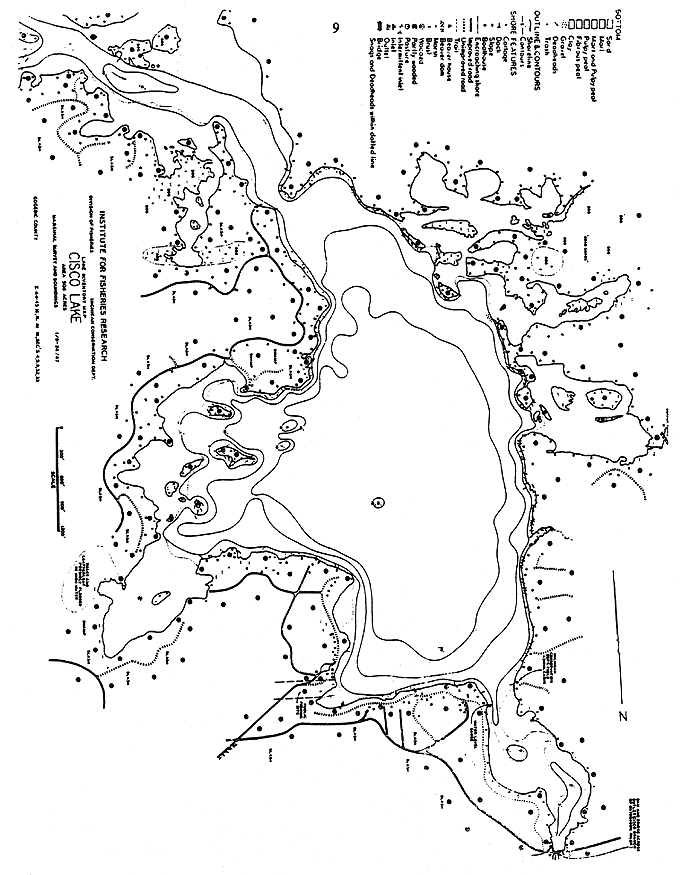
Michigan Department of Natural Resources Gogebic County (T44, 45N, R41W, Sec. 4,5,8,9,32,33) Surveyed June, 1992 William L. Deephouse Environment Cisco Lake is located approximately 13 miles southwest of Watersmeet
in Gogebic County and is part of the Cisco Lake Chain. The lake is 506
acres in size and has a maximum depth of 20 feet (see
map of Cisco Lake). Aquatic vegetation is abundant and consists mainly
of submergent and emergent types. Additional fish cover in the lake includes
logs and rocks. The shoals are gradual in flooded areas but quite steep
in the main basin and are composed primarily of sand in the main basin
and pulpy peat in the remaining areas. Spawning substrate is sufficient
for the reproduction of all species inhabiting the lake. The state maintains
a public access site on the northeast shore. There are inlets from both
Thousand Island Lake and Lindsley Lake. The lake outlets to the north
and is the origin of the Cisco Branch of the Ontonagon River. Being a part of the Cisco Lake Chain, the water level is held artificially
high by a dam on the outlet of Cisco Lake. The dam was constructed sometime
prior to the 1930s and probably originated as a logging dam. In 1937 the
Copper District Power Company purchased the dam and subsequently, in 1948,
the Upper Peninsula Power Company purchased the dam. The purpose of the
dam to this day is to provide water for power generation at Victoria Dam
many miles downstream on the Ontonagon River. The elevated water level
also permits the passage of boat traffic through several lakes in the
Chain which would not be otherwise possible. During the late 1930s, a structure known as a Barr Fish Lock was installed
on the downstream side of the dam to lift fish from the river below into
the lake. It met with limited success and is not operable at this time. Chemical-physical parameters of the lake, measured since 1971, include
pH readings between 6.8 and 7.8, Secchi disk readings of 4.6 to 14.0 feet,
and an methyl orange alkalinity of 54 ppm (1971). The lake appears to
be homothermous most of the time and sufficient oxygen is present for
fish at all depths. Cisco Lake has a history of fish management dating back to the early
1930s. Several species of fish, including yellow perch, walleye, and rainbow
trout have been stocked through the years. Walleye fingerlings were stocked annually from 1982 to the present, except
for 1990 and 1991 when no plants were made. Most were sponsored by the
Cisco Chain Riparians Association. Fry plants were made in 1985 and 1986.
The most recent plant of 28,000 fingerling walleyes was made in 1992 by
the MDNR. Fishery surveys have generally found quite good populations of walleye,
smallmouth bass, bluegill, yellow perch, and rock bass. Northern pike
also inhabit the lake, but complaints have occurred over the years of
numerous small pike and presently there is no size limit for that species.
Occasionally, muskys have been reported. In general, the fishing on Thousand
Island, as well as the rest of the lakes in the Chain, has been quite
good. In recent years, surveys were conducted in July 1988, May 1990, and June
1992. Fyke nets were used to sample the fish population. The nets were
fished for 2 days in 1988 and 1990 and for 3 days in 1990. These closely spaced surveys have enabled us to track changes that have
taken place since a survey in 1975. Walleyes, the primary predator here,
have shown an increase in size (15.9 inches to 18.0 inches) during this
time period. However, their relative abundance has declined from 26.6%
by weight of the catch in 1975 to 16.5% in 1992. Their numerical abundance
(CPE) dropped to 2.7 walleye per net-night in 1992. This is a substantial
drop from a CPE of 8.6 in 1990. Walleye CPE was 4.9 in 1975 and 3.1 in
1988. In the spring of 1991, members of the Lac Vieux Desert Indian tribe began
spearing this lake. A total of 88 adult walleyes were speared with an
average length of 16.3 inches. The lake was again speared in 1992 and
114 walleyes were harvested; they also averaged 16.3 inches. A safe spearing
quota of 117 fish has been set for 1993. The bluegill and pumpkinseed population has dramatically increased in
recent years. Combined, they only represented 8.1% of the collection by
weight in 1975 compared to 44.1% in 1992. The average length of the pumpkinseeds
has remained stable during this period. On the other hand, bluegill average
size increased from 6.5 inches in 1975 to 7.5 inches in 1990 but declined
to 6.0 inches in the most recent survey. In order to evaluate the bluegill population in Cisco Lake, the method
detailed in Schneider (1990) was used. The bluegill catch for surveys
from 1971 to the present were examined and scored. The results are as
follows:
Using this method to evaluate survey data, the bluegill population still
appears to be in decent shape. However, the number of large fish in the
population is declining while abundance is increasing (Tables 1 and 2).
There are various reasons for this, among them sampling variability. Increased
sportfishing harvest may also be a contributing factor. Lowered predator
abundance could be allowing excessive numbers of small bluegills to survive.
Future surveys will allow us to track developments in the panfish community. Yellow perch relative abundance has declined from 33.2% by weight in
1975 to 10.6% in 1990 and 11.1% in 1992. Perch have been replaced by expanding
bluegill and pumpkinseed populations. The large walleye population that
was present in the lake in the late 1970s and early 1980s was probably
responsible for most of the decline. We suspect that perch numbers will
rebound now that walleye numbers are low. Northern pike size and abundance has stayed fairly constant from 1975
to 1992. They remain small and slow growing. There is no size limit on
pike in the Cisco Chain. Northern muskellunge are also native to the Cisco Chain and occasionally
trophy specimens are taken. Single individuals were collected in the 1990
and 1992 surveys. Both largemouth and smallmouth bass numbers continue
to be low. Black crappie were found during the 1988 survey but were not encountered
in 1975. Their population seemed to be increasing in the 1990 survey when
they represented 8.7% by weight of the collection. But their relative
abundance declined to 3.8% in the most recent survey. Average size has
ranged between 9.1 and 11.0 inches. Rock bass and brown bullhead have always been found in the lake, and
their numbers and biomass have remained quite constant over the last 17
years. They are not anywhere near nuisance levels. White suckers are just
about nonexistent, being taken in only the 1988 survey. In general, it appears that the bulk of the fish populations are holding
up fairly well over time although bluegill and sunfish populations are
filling in where the perch has declined. Fishing opportunities on Cisco
Lake, as well as the rest of the lakes in the Chain, have been quite good
and should remain so. A. Current management. Cisco Lake has a generally well-balanced fish community comprised of
a variety of gamefish. It is producing a decent fishery at the present
time. However, if future surveys show the predator biomass continuing
to decline, additional fingerling walleye stockings are recommended. The
primary predator is the walleye and a close watch should be maintained
to assure this population is reproducing and healthy. If their abundance
goes lower, the fish community of the entire lake will be adversely effected.
Surveys should be conducted at least every 3 years on this large, important
lake. B. Goals and expectations. The management goal for Cisco Lake is the same as for the entire Cisco
Chain, that being to maintain well-balanced and diverse species complexes
in these lakes to provide good fishing for all user groups. To accomplish
that goal, it may be necessary to stock fish (notably walleye) and to
periodically manipulate the populations of species which may become overabundant
or stunt (bluegill, perch, rock bass, etc.). Specific goals include: 1. Maintain the predator biomass at 30%, to provide an attractive sport
fishery and control undesirable species while maintaining a balanced panfish
community. Predators include walleye, northern pike, smallmouth bass,
largemouth bass, and northern muskellunge. 2. Maintain high average size of panfish. Minimum targets are 7.0 inches
for bluegill, 10.0 for black crappie, and 8.0 for yellow perch . 3. Determine if the walleye population is sustaining itself through natural
reproduction. C. Obstacles to attainment of goals. Keeping a healthy population of walleyes in this lake is essential to
maintaining the fish community in a well-balanced condition. If excessive
numbers of this predator are withdrawn from the lake, for whatever reason,
panfish species may become overabundant. Natural reproduction also appears
to have declined over the last several years. This may be due to normal
year-to-year variation but might be an indication of some other problem. Report completed: March 1, 1993. Schneider, J.C. 1990. Classifying bluegill populations from lake survey
data. Michigan Department of Natural Resources, Fisheries Technical Report
90-10, Ann Arbor. Table 1.-Number, weight and length indices of fish collected from
Cisco Lake with 3/4 inch mesh fyke nets, June 16-18, 1992.
Table 2.-Number, weight and length indices of fish collected from
Cisco Lake with 3/4 inch mesh fyke nets, May 21-24, 1990.
Table 3.-Average total length (inches) at age, and growth relative
to the state average, for three species of fish sampled from Cisco Lake
with 3/4 inch mesh fyke nets, May 21-24, 1990. Number of fish aged is
given in parentheses. All fish aged by spine analysis.
Table 4.-Estimated age frequency (percent) of three species of
fish caught from Cisco Lake with 3/4" fyke net, May 29-31, 1990.
Last Update: 08/05/02
[email protected] |
|||||||||||||||||||||||||||||||||||||||||||||||||||||||||||||||||||||||||||||||||||||||||||||||||||||||||||||||||||||||||||||||||||||||||||||||||||||||||||||||||||||||||||||||||||||||||||||||||||||||||||||||||||||||||||||||||||||||||||||||||||||||||||||||||||||||||||||||||||||||||||||||||||||||||||||||||||||||||||||||||||||||||||||||||||||||||||||||||||||||||||||||||||||||||||||||||||||||||||||||||||||||||||||||||||||||||||||||||||||||||||||